Categories
Data Methods

Modelling efficient access to agro-dealers in Malawi

In 2010 I co-authored a paper that investigated the locational efficiency of agro-dealers in central Malawi. We analysed the accessibility to existing trained agro-dealers in a raster environment using the ‘costdistance’ algorithm in the ESRI Arc/INFO software. The trained agro-dealers did not cover sufficient population when we modelled farmers’ accessibility using bicycles or walking.

To choose new agro-dealers for training I programmed a ‘greedy-add’ heuristic in Arc Macro Language (AML), accessing points from shapefiles of potential new agro-dealers, and raster grids in native ESRI format.

Since Arc/INFO is no longer a component of ArcGIS I have been investigating how to replicate the heuristic and the accessibility analysis in PostgreSQL/PostGIS and R environments.

I tried two methods, the first used the gdistance and raster packages in R, and the second used the pgRouting and PostGIS extensions in PostgreSQL.

gdistance and raster packages in R

My previous AML approach used existing raster accessibility algorithms within a custom made heuristic for determining near optimal locations of stockists. I followed the same logic in R with only slight differences because gdistance uses a transition layer.

I also updated the population using the 2020 constrained 1km population count from WorldPop, Land Cover from Copernicus, and the road network from OpenStreetMap.

To cover 80% of the population the algorithm added 61 new agro-dealers.

Cumulative effect on the population within 1 hour (by bicycle) of trained agro-dealers

pgRouting and PostGIS extensions in PostgreSQL

The pgRouting library extends the PostGIS / PostgreSQL geospatial database to provide geospatial routing functionality.

The pgRouting library computes the shortest paths in a network of lines (edges) and points (nodes). Consequently, I had to convert my raster friction surfaces to a network of edges – each with a travel time cost.

I also needed to ensure that the nodes on the network had population attributes and that the potential agro-dealer locations were ‘snapped’ to the nodes. I prepared these data using PL/pgSQL scripts, taking advantage of PostGIS spatial indexes.

‘Snapping’ the potential new agro-dealers to the friction network

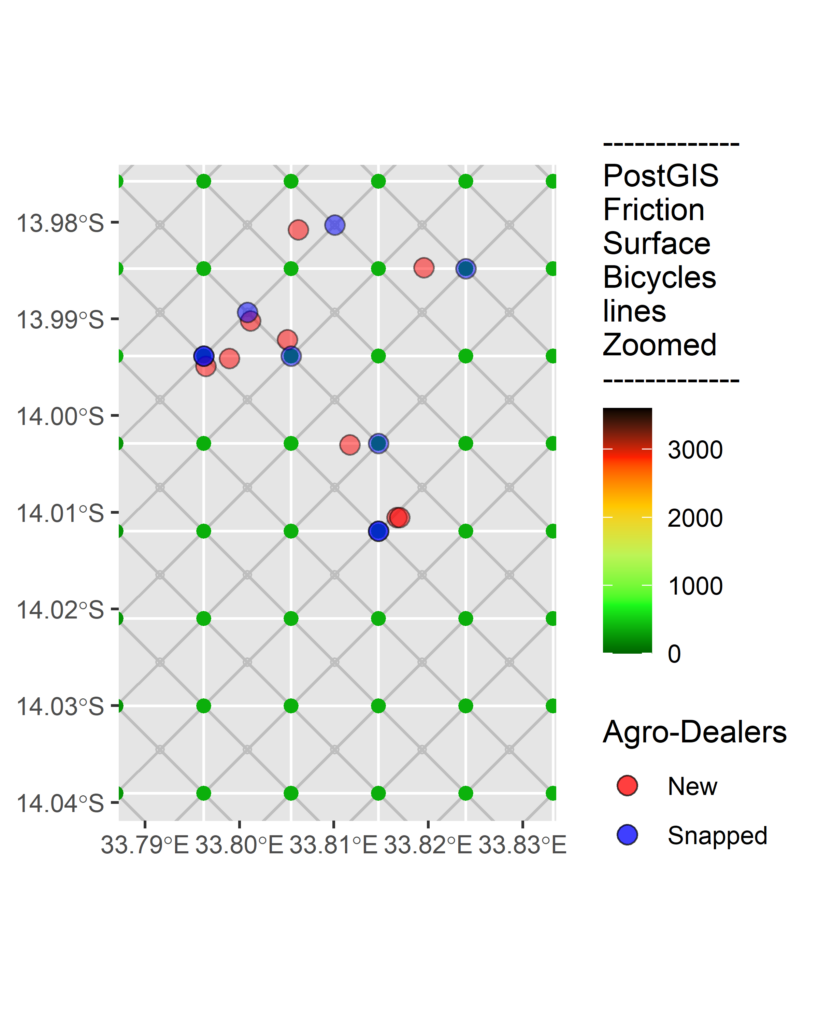
I followed a similar logic to the greedy-add algorithm in R, but using instead the pgrdijkstra function repeatedly over the network and calculating the population of all end-nodes within 1 hour of each potential agro-dealer.

Despite pgrdijkstra and gdistance both using Dijkstra’s shortest path algorithm the vector method in pgRouting only required a further 59 agro-dealers to cover 80% of the population within an hour.

Conclusion

The gdistance method was considerably faster than the pgRouting method, and required less data preparation. Nevertheless, both methods took at least 2 hours to run on an average laptop.

I have yet to discover the reason for the difference in the results of the two algorithms, both consider 8 directions, and I have yet to find differences in the shortest paths between specific sources and targets.

Apart from discovering the discrepancies between the results, my next objective is to see how best to scale these methods and see if it is possible to simplify and potentially automate them.

Categories
Data Publications

New Bean Atlas of Africa released

The Atlas of Common Bean (Phaseolus vulgaris L.) Production in Africa, has been updated with new information and addresses additional topics such as bean seed systems, and the consumption and use of beans. Go to the storymap for access to the spatial data and the book pdf.

The new Atlas is digital and available as a dynamic, interactive online version with selected maps.

We identified a total of 176 bean production areas. We used a form of the Delphi method of consensus building among experts from almost all bean-producing countries of sub-Saharan Africa. We collected data for: bean production, cropping systems and producers; seed systems; bean use and marketing; bean grain types and varieties; and abiotic and biotic constraints to bean production and storage.

We compiled data on harvested area and production from a variety of sources and allocated among bean production areas using local expert knowledge and/or sub-national statistics. We computed and characterised each bean production area within 17 different bean environments.

African Bean Environments displayed in the online version of the Atlas of Common Bean Production in Africa
Categories
Projects

GeAgrofía diagnosing the spatial impacts of reduced mobility due to COVID-19 in Ethiopia

We simulated the impacts of COVID-19 mobility restrictions in Ethiopia, based on a reduction in the time that farmers would be willing to travel to obtain agricultural inputs and receive advice from extension officers. The restrictions negatively impact almost a third of the population and cropland in our selected woreda.

The impact of mobility restrictions on accessibility to Farmer Training Centres
Categories
Publications

GeAgrofía co-author of paper “A spatial framework for ex-ante impact assessment of agricultural technologies”

In this study, we developed a data-rich spatial framework to guide agricultural research and development prioritisation and to perform ex-ante impact assessment. The framework uses “technology extrapolation domains”, which delineate regions with similar climate and soil type combined with other biophysical and socio-economic factors that influence technology adoption.

Paper available here.

A generic framework for ex-ante impact assessment in rainfed crop agriculture
Categories
Projects Training

GeAgrofía training Ethiopian GIS professionals on recommendation domain mapping of agricultural best fit innovations

Categories
Publications

Stakeholder roles in Sub-Saharan African agricultural netchains paper published

Paper available here.

Categories
Publications

Mapping Agricultural Suitability report available from UNEP-WCMC

This report provides an overview of existing approaches to mapping agricultural suitability, including review of the underlying data, at different scales. Mapping land use suitability can help identify the best places for different future land uses and support a more efficient and effective use of resources and energy to satisfy changing patterns of human consumption, to slow global warming and to reduce the rate of loss of ecosystem services and biodiversity.

Get the report here.